SQL Server Performance Dashboard using PowerBI (download)
This project has become so popular that I decided to give it its own home: SQLWATCH.IO. Thank you #SQLFamily!
Introduction
I often help improve the performance of a SQL Server or an application. Performance metrics in SQL Server are exposed via Dynamic Management Views (DMVs). However, DMVs only provide a view of the current state and no history. This is important as it makes it particularly difficult to draw a bigger picture of how the system is behaving over time and what problems are occurring during overnight batch processing or during peak operational times, for example when users log in to the system at 8 am or when they leave for lunch at 1 pm.
The built-in Windows Performance Monitor can be used to record performance data over time and it’s great at it but not really designed for long runs and also can be quite difficult to read and analyse data.
To address this deficiency I have built a simple yet comprehensive SQL Server Performance Dashboard in PowerBI. PowerBI Desktop is a free data visualisation and analytics tool from Microsoft. You can download a free copy from their website: https://powerbi.microsoft.com/en-us/.
Data collection
Concept
As mentioned above, SQL Server does not provide historical performance data so we have to collect and store it somewhere.
We are going to collect majority of the data from the following DMVs:
- sys.dm_os_performance_counters
- sys.dm_os_process_memory
- sys.dm_os_memory_clerks
- sys.dm_os_wait_stats
- sys.dm_io_virtual_file_stats
- sys.master_files
and store output in physical tables in a user database. I suggest a dedicated “DBA” database.
Storage Schema
In order to provide consistent correlation point and time dimension, I am using a header table.
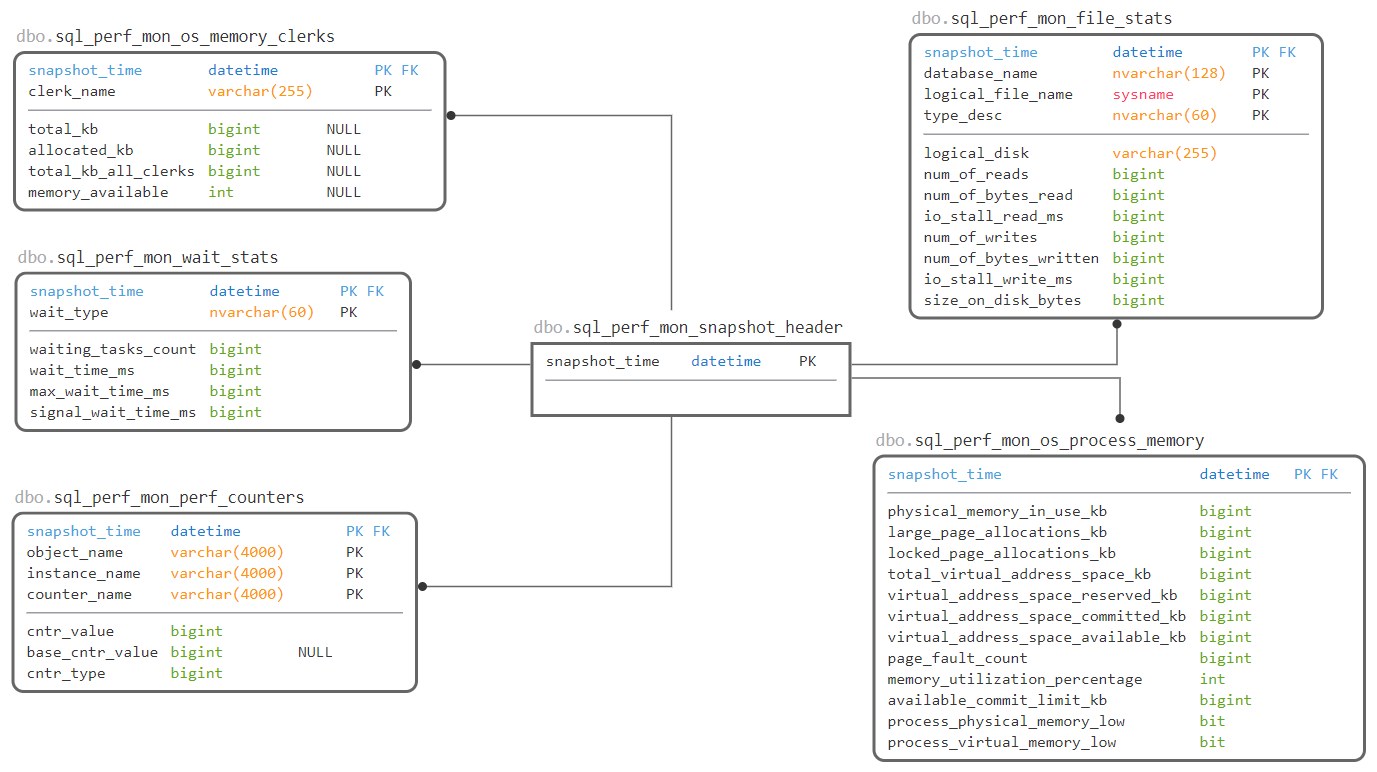
Configuration and reference tables:
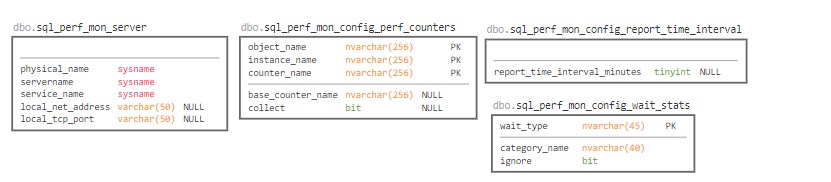
dbo.sql_perf_mon_serverserver name so we can show it in the text box. I tried not to reference system objects i.e.@@SERVERNAMEfrom PowerBI so we can grant read-only permissions to a wider audience.dbo.sql_perf_mon_config_perf_counterslist of performance counters and their base counter when applicable with an on/off flag indicating what to collectdbo.sql_perf_mon_config_report_time_intervalavailable time intervals. By default, there are two: 5 and 15 minutes. This is NOT how often data is collected – read below what this means.dbo.sql_perf_mon_config_wait_statslist of popular waits with their category as categorised by Microsoft.
Invocation
The collection is invoked by running stored procedure via SQL Agent Job every 1 minute with 12 seconds offset to avoid clashing with other jobs starting at the full minute.
Performance Overhead
The performance overhead of data logging is very low although overall performance will depend on the retention period. By default, the retention job is set to delete anything older than 7 days.
Reporting
Data collection was the easy part. Reporting is slightly more complex due to the way performance data is presented in DMVs. In principle SQL Server performance data be:
- cumulative – constantly increasing value since the server restart. For example wait stats.
- point-in-time – current value at a time of querying DMV. For example Current Connections.
The point in time metrics are easy and we do not have to do much with them. However for the cumulative values in order to present over a period of time we have to calculate the difference (delta) between two cumulative snapshots.
Calculate delta from cumulative figures
Let’s look at sys.dm_io_virtual_file_stats as an example. Assume we have run the following statement:
/* get the first snapshot */
select database_id, file_id, num_of_bytes_read, num_of_bytes_written, io_stall_read_ms, io_stall_write_ms
from sys.dm_io_virtual_file_stats (default, default)
where database_id = 2 --tempdb
/* generate some load in tempdb */
select *
into tempdb.dbo.test
from sys.messages
/* get the second snapshot */
select database_id, file_id, num_of_bytes_read, num_of_bytes_written, io_stall_read_ms, io_stall_write_ms
from sys.dm_io_virtual_file_stats (default, default)
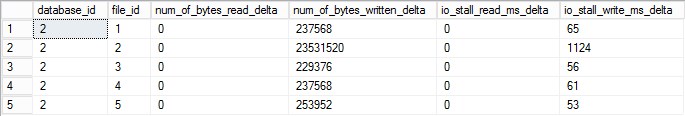
where database_id = 2 --tempdbWhich, for a tempdb with 4 data files produced the following output:
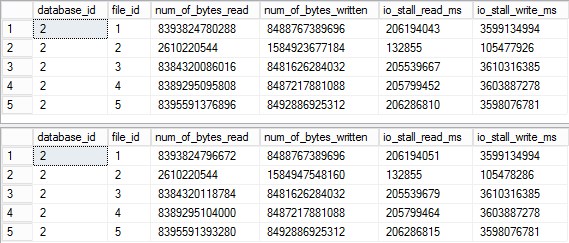
And according to Microsoft Books, we know that columns in the example above show a total number of bytes written/read and total stall on the file. Total – Ever. https://docs.microsoft.com/en-us/sql/relational-databases/system-dynamic-management-views/sys-dm-io-virtual-file-stats-transact-sql
To calculate delta workload that happened between first and second snapshots we have to do the following:
/* store first snapshot in a table */
select database_id, file_id, num_of_bytes_read, num_of_bytes_written, io_stall_read_ms, io_stall_write_ms
into #snapshot1
from sys.dm_io_virtual_file_stats (default, default)
where database_id = 2 --tempdb

select *
into tempdb.dbo.test
from sys.messages

select fs.database_id, fs.file_id
  /* calculate difference between values from first and second snapshot */
  , num_of_bytes_read_delta=(fs.num_of_bytes_read-s1.num_of_bytes_read)
  , num_of_bytes_written_delta=(fs.num_of_bytes_written-s1.num_of_bytes_written)
  , io_stall_read_ms_delta=(fs.io_stall_read_ms-s1.io_stall_read_ms)
  , io_stall_write_ms_delta=(fs.io_stall_write_ms-s1.io_stall_write_ms)
from sys.dm_io_virtual_file_stats (default, default) fs
/* join on the first snapshot to get previous values */
inner join #snapshot1 s1
  on fs.database_id = s1.database_id
  and fs.file_id = s1.file_id
where fs.database_id = 2 --tempdb
Which gives us the actual values:
Calculate deltas for multiple snapshots
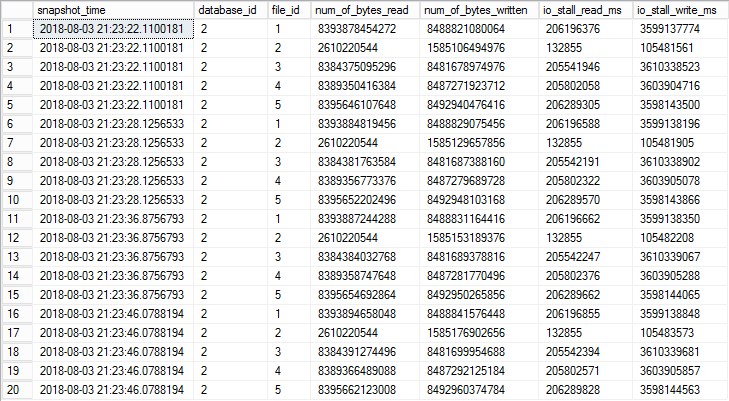
Great. But that’s just two snapshots. How are we going to calculate this delta for all snapshots in chronological order? Let’s create more snapshots. Notice I have added a new column with the snapshot time:
select snapshot_time=sysdatetime(), database_id, file_id, num_of_bytes_read, num_of_bytes_written, io_stall_read_ms, io_stall_write_ms
into #snapshots
from sys.dm_io_virtual_file_stats (default, default)
where database_id = 2 --tempdb

select *
into tempdb.dbo.test
from sys.messages

insert into #snapshots
select snapshot_time=sysdatetime(), database_id, file_id, num_of_bytes_read, num_of_bytes_written, io_stall_read_ms, io_stall_write_ms
from sys.dm_io_virtual_file_stats (default, default)
where database_id = 2 --tempdb

insert into tempdb.dbo.test
select *
from sys.messages

insert into #snapshots
select snapshot_time=sysdatetime(), database_id, file_id, num_of_bytes_read, num_of_bytes_written, io_stall_read_ms, io_stall_write_ms
from sys.dm_io_virtual_file_stats (default, default)
where database_id = 2 --tempdb

insert into tempdb.dbo.test
select *
from sys.messages

insert into #snapshots
select snapshot_time=sysdatetime(), database_id, file_id, num_of_bytes_read, num_of_bytes_written, io_stall_read_ms, io_stall_write_ms
from sys.dm_io_virtual_file_stats (default, default)
where database_id = 2 --tempdb
Which gives the following output:
To calculate deltas for all snapshots we use the same principle but with an additional snapshot_id column which in this example is calculated on the flight using ROW_NUMBER()
select
  first_snapshot_time=s1.snapshot_time, last_snapshot_time=s2.snapshot_time, s2.database_id, s2.file_id
  /* calculate difference between values from first and second snapshot */
  , num_of_bytes_read_delta=(s2.num_of_bytes_read-s1.num_of_bytes_read)
  , num_of_bytes_written_delta=(s2.num_of_bytes_written-s1.num_of_bytes_written)
  , io_stall_read_ms_delta=(s2.io_stall_read_ms-s1.io_stall_read_ms)
  , io_stall_write_ms_delta=(s2.io_stall_write_ms-s1.io_stall_write_ms)
from (
  select *
    /* additional id to help join onto the previous row */
    , snapshot_id=row_number() over (partition by database_id, file_id order by snapshot_time)
  from #snapshots
  ) s2
/* join on the first snapshot to get previous values */
inner join (
  /* additional id to help join onto the previous row */
  select *
    , snapshot_id=row_number() over (partition by database_id, file_id order by snapshot_time)
  from #snapshots
  ) s1
  on s2.database_id = s1.database_id
  and s2.file_id = s1.file_id
  /* now we use the additional id column in a join */
  and s2.snapshot_id -1 = s1.snapshot_id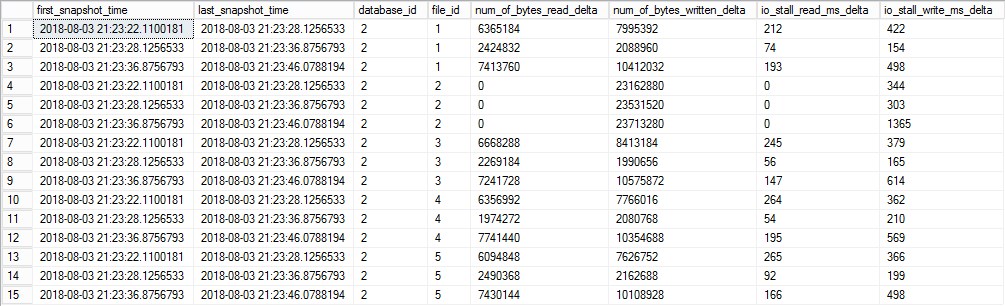
Notice there is only 15 rows vs original 20 (5 data files captured 4 times = 20 total rows). This is because there is nothing to subtract the last snapshot from.
Calculate deltas for specific time intervals
Ok, great but this calculates the delta between all snapshots which will create a lot of data points for reports covering longer time periods. So how are going to calculate deltas over 5 or 15 minutes periods? We will have to create a dimension-like view with the time periods we need. To make this even more interesting we want this view to be flexible and show different time-spans.
This is how the reference view looks like:
select
    [spapshot_interval_start]
  , [snapshot_interval_end] = dateadd(mi, [report_time_interval_minutes], [spapshot_interval_start])
  , [first_snapshot_time]   = MIN(i.snapshot_time)
  , [last_snapshot_time]    = MAX(i.snapshot_time)
  , [report_time_interval_minutes]
/* notice we are now using our header table
which also serves as time dimension (driver) */
from [dbo].[sql_perf_mon_snapshot_header] s
inner join (
  select
      [snapshot_time]
     ,  [spapshot_interval_start] = convert(datetime,dateadd(mi,(datediff(mi,0, [snapshot_time])/ ti.[report_time_interval_minutes]) * ti.[report_time_interval_minutes],0))
     ,  ti.[report_time_interval_minutes]
  from [dbo].[sql_perf_mon_snapshot_header]
  cross apply (
    select top 5 report_time_interval_minutes
    from [dbo].[sql_perf_mon_config_report_time_interval]
    order by report_time_interval_minutes
    ) ti
  ) i
  on s.snapshot_time > [spapshot_interval_start]
  and s.snapshot_time <= dateadd(mi, [report_time_interval_minutes], [spapshot_interval_start])
group by [spapshot_interval_start], [report_time_interval_minutes]
Let’s focus on the subquery used in join which utilises cross apply.
select
    [snapshot_time]
   ,    [spapshot_interval_start] = convert(datetime,dateadd(mi,(datediff(mi,0, [snapshot_time])/ ti.[report_time_interval_minutes]) * ti.[report_time_interval_minutes],0))
   ,    ti.[report_time_interval_minutes]
from [dbo].[sql_perf_mon_snapshot_header]
cross apply (
  select top 5 report_time_interval_minutes
  from [dbo].[sql_perf_mon_config_report_time_interval]
  order by report_time_interval_minutes
) ti
Which creates a simple reference list of all snapshots with the original snapshot time and time rounded down to the nearest 5 or 15 minutes (balls, just noticed the typo in the column name!)
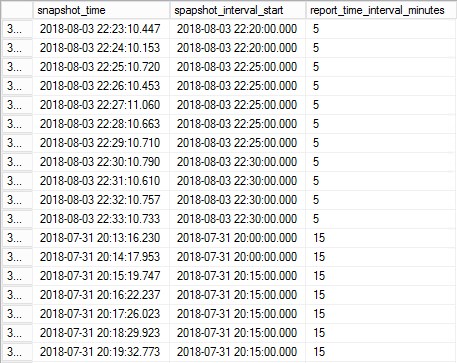
This subquery gives us the first part of the snapshot interval and allows us to calculate the interval end time based on start + interval minutes which gives the following output. The rounded down interval start, interval end based on the interval minutes and first snapshot in the interval and last snapshot in the interval:
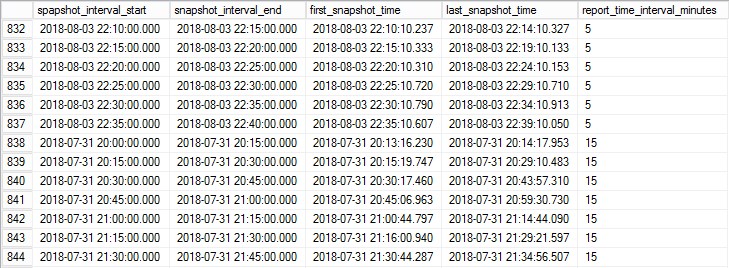
Now with this query saved as view, [dbo].[vw_sql_perf_mon_time_intervals] we can use a similar approach as used in the example above but joining on first_snapshot_time and last_snapshot_time rather than snapshot_id. Let’s have a look at the same file statistics query utilising the new interval table:
select
   [report_name] = 'File Stats'
  ,[report_time] = s.[snapshot_interval_end]
  ,fs2.[database_name]
  ,fs2.[type_desc]
  ,fs2.[logical_disk]
  ,[num_of_mb_transferred_delta] = ((fs2.[num_of_bytes_read] - fs1.[num_of_bytes_read]) + (fs2.[num_of_bytes_written] - fs1.[num_of_bytes_written])) / 1024.0 / 1024.0
  ,[io_stall_read_ms_delta] = ((fs2.[io_stall_read_ms] - fs1.[io_stall_read_ms]) + (fs2.io_stall_write_ms - fs1.io_stall_write_ms))
  ,s.[report_time_interval_minutes]
from [dbo].[sql_perf_mon_file_stats]  fs1
inner join [dbo].[vw_sql_perf_mon_time_intervals] s
  /* this gets us first snapshot from the interval */
  on fs1.snapshot_time = s.first_snapshot_time
inner join [dbo].[sql_perf_mon_file_stats]  fs2
  on fs1.database_name = fs2.database_name
  and fs1.logical_file_name = fs2.logical_file_name
  /* and this gets us last snapshot in the interval */
  and fs2.snapshot_time = s.last_snapshot_time
Presentation tier (the Dashboard)
Power BI is relatively easy to use yet powerful which can have it’s consequences when it comes to performance. IT offers two ways of getting data: Import and Direct Query. In short, import “downloads” all the data into the report and Direct Query does not. The benefit of the import is that we can download once and slice and dice it without querying the database. Another benefit is that because data is within the report itself, we can email it to someone who does not have access to the database (this is a bad idea if one is not supposed to have access to the data one way or another).
For this reason, I have used Import mode but with customised queries to limit the amount of data PowerBI downloads and thus greatly improve performance and minimise the impact on the source database. For this to happen I have created a number of parameters:
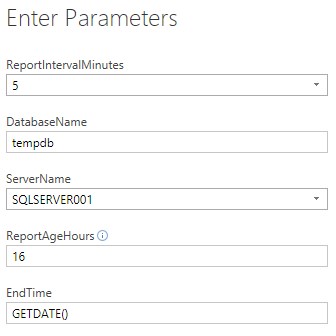
- ReportIntervalMinutes – as described above, the snapshot interval. Either 5 or 15 minutes.
- DatabaseName – which database our tables reside in. In my example this is tempdb
- ServerName – Name of the server to connect to
- ReportAgeHours – How far back does it go from EndTime.
- EndTime – Either custom date i.e. ‘2018-08-01’ or GETDATE() — notice the quotes around date and no quotes around GETDATE().
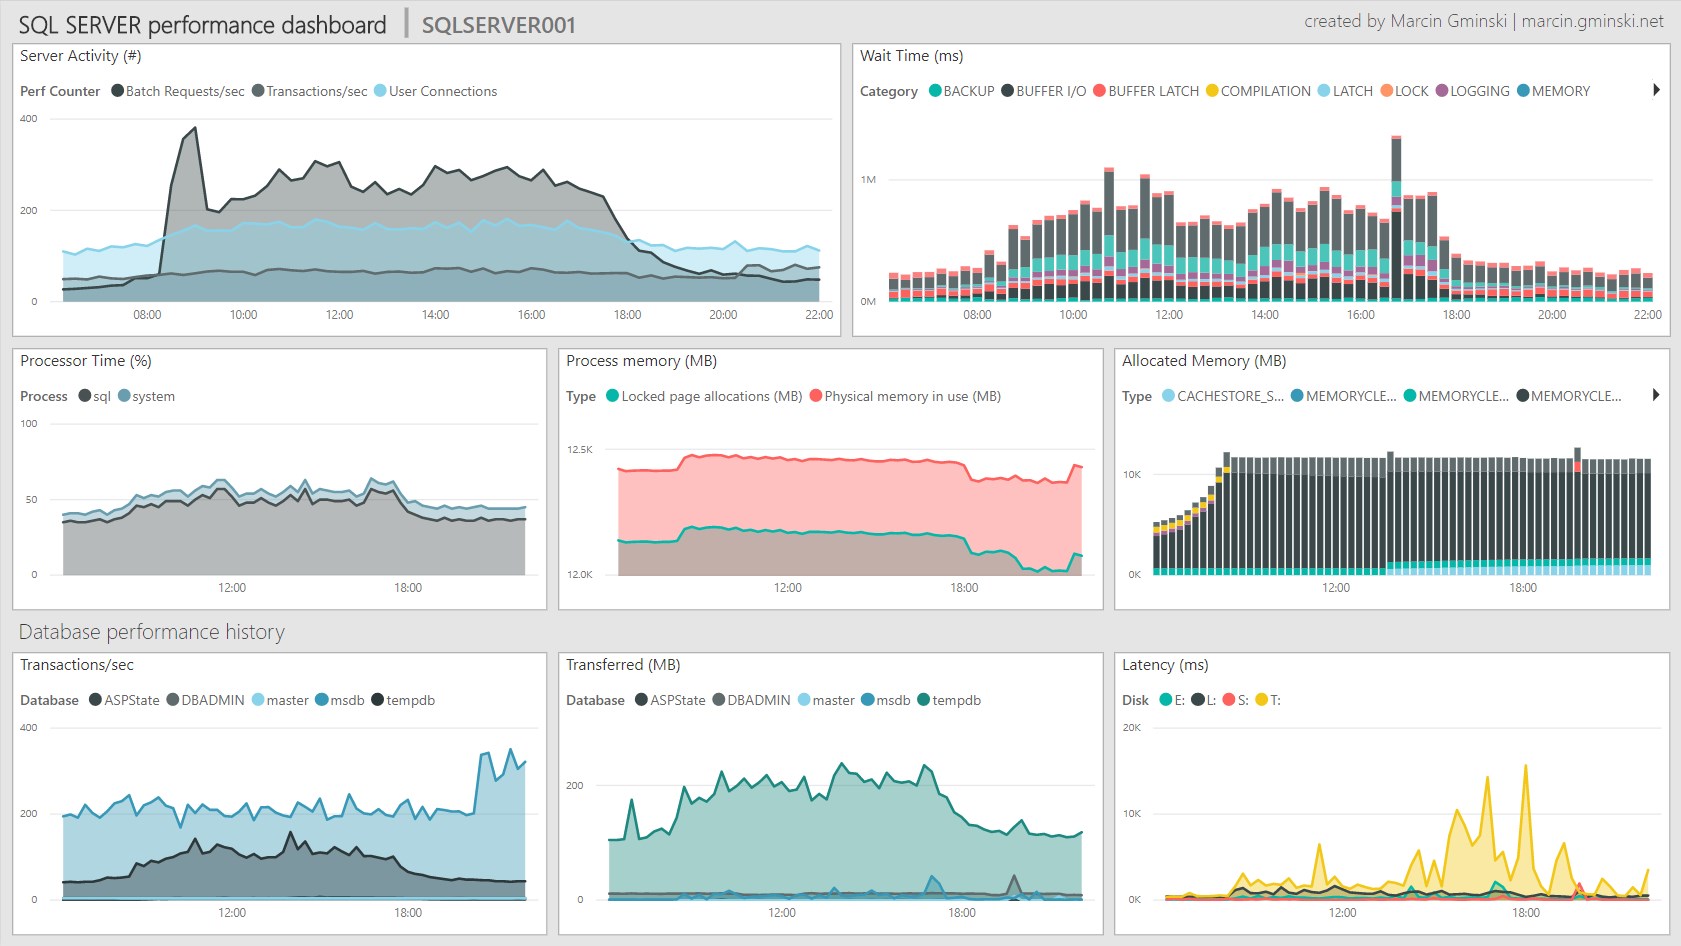
In the example below the report will pull data from 16 hours ago to now. If we wanted to see data for yesterday we would have to change EndTime to relevant date/time.
You will notice that continuous measures, such as CPU and Activity are shown as area charts and those that can have gaps, for example, wait statistics are shown as bar charts. This is because line charts aren’t very good at plotting data series with gaps whereas bar charts do not require such continuity.
Expansion and custom counters
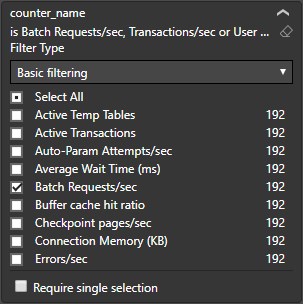
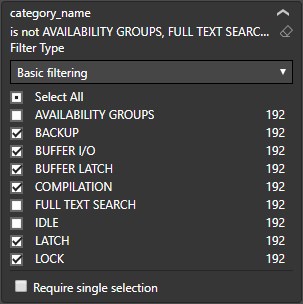
As we are collecting much more Performance counters than we show on the dashboard, you are free to create your own graphs for Performance counters and Wait stats you are interested in:
Please refer to this great Performance counter poster from Quest Software: https://github.com/marcingminski/sql-performance-monitor/blob/master/SQLServer-Performance-Poster.pdf to learn more about which counters are worth attention.
Data retention
You must run the retention procedure otherwise it can grow at a fast pace depending on the SQL workload and number of databases. By default, the retention is scheduled to 7 rolling days and its best to run the retention job often to delete small chunks of data rather than one big run once a week which, due to cascade delete can blow transaction log. The query itself is very simple:
declare @rowcount int = 1

while @rowcount > 0
  begin
    begin tran
      delete top (200)
      from [dbo].[sql_perf_mon_snapshot_header]
      where snapshot_time < DATEADD(day,-7,getdate())
      set @rowcount = @@ROWCOUNT
    commit tran
  end
Installation
Simply execute the setup script which will create all necessary objects and jobs. To uninstall execute uninstall script which will remove it all including history tables so you will lose it all.
To download a copy go to GitHub:
Known limitations
When SQL Server is restarted performance data is reset and my report will show negative values as the delta will be negative. There is a way around it to check if the second snapshot’s value is greater than first’s and if not show 0. I will implement this in the next release. If you would like to be notified about future releases and updates to SQL Server Performance Dashboard please subscribe to my blog.
Next steps
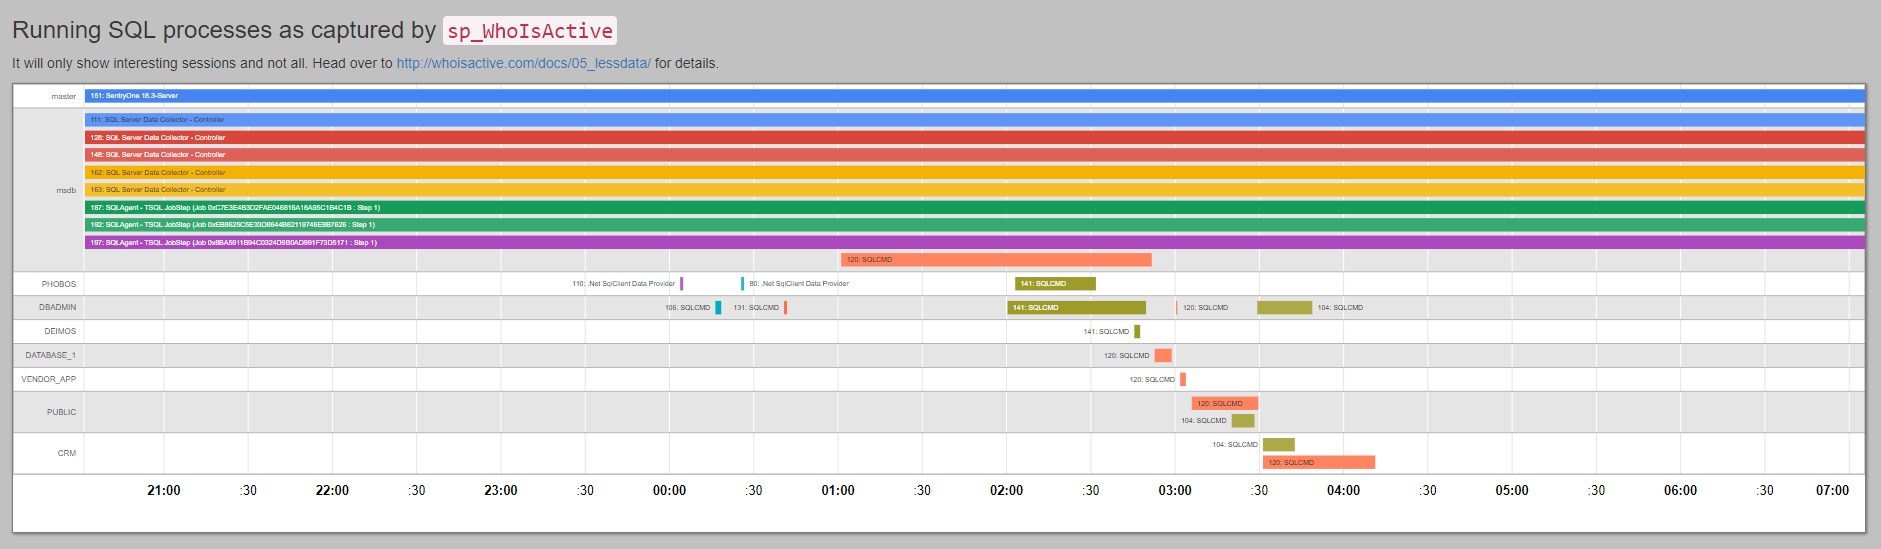
I actually mentioned earlier on that PowerBI is quite powerful. Well, yes but is also quite limited. I have a proof of concept timeline (Gantt chart) report for Adam Machanic’s sp_whoisactive output but sadly cannot make it work in PowerBI. Here’s an example using Google Charts, Bootstrap and good old HTML. If you know how to make this happen in PowerBI please let me know:
Thanks for reading!
This post was originally published on February 22, 2020.